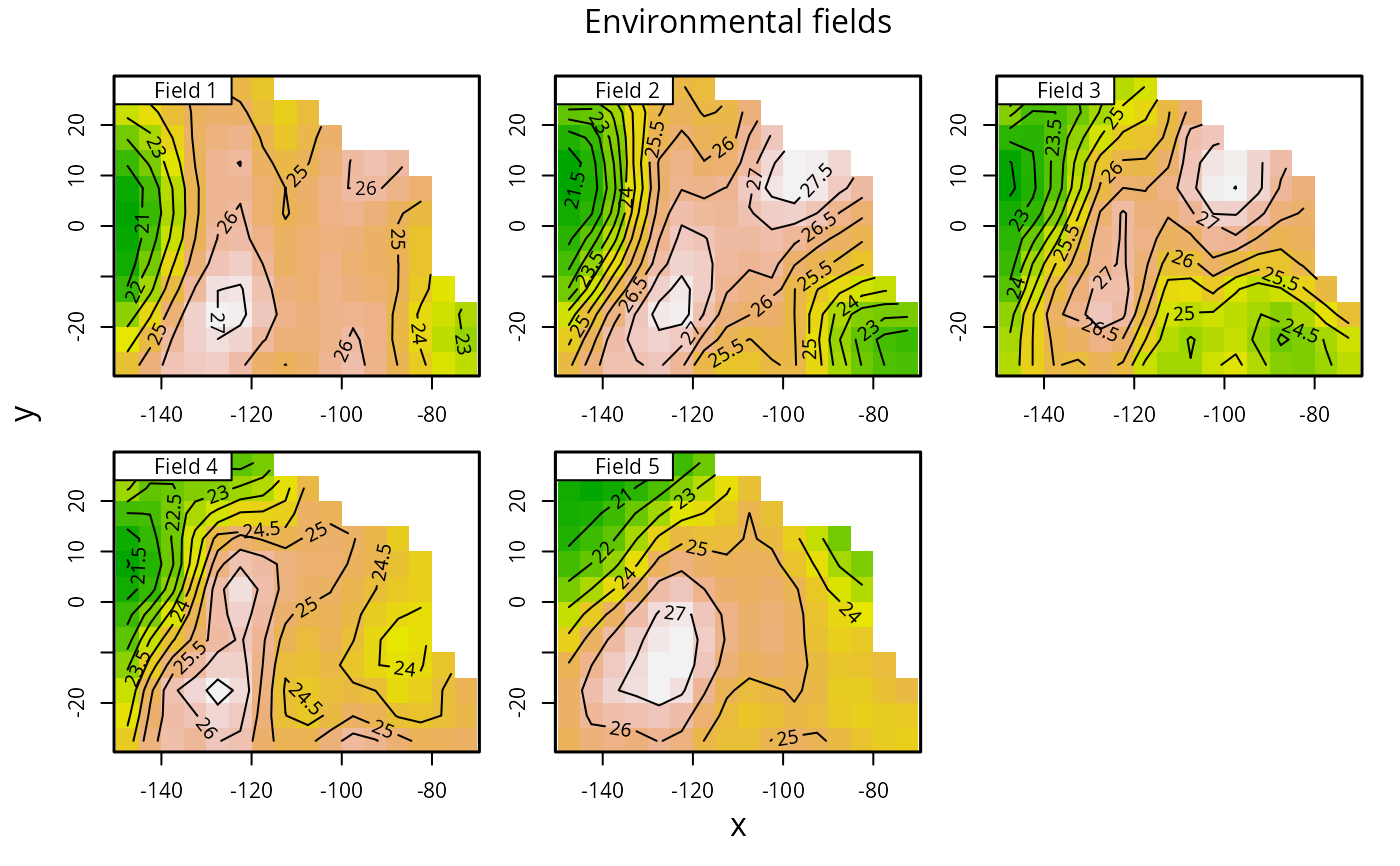
Plot the environmental fields of any momo object that contains environmental data.
Usage
plotmomo.env(
  x,
  select = NULL,
  main = "Environmental fields",
  labels = TRUE,
  plot.land = FALSE,
  keep.gpar = FALSE,
  xlab = "x",
  ylab = "y",
  bg = NULL,
  plot.contour = TRUE,
  ...
)
Arguments
- x
a grid or a list of class
momo.data,momo.sim, ormomo.fit.- select
optional; allows to select specific time steps. Default:
NULL.- main
a main title for the plot. Default:
Environmental fields.- labels
logical; If
TRUE(default), plot numbers in cells.- plot.land
logical; If
TRUE, plot land masses using the function maps::map. Default:FALSE.- keep.gpar
logical; If
TRUE, do not overwrite the graphical parameters. Default:FALSE.- xlab
a label for the x axis. Default: "x".
- ylab
a label for the y axis. Default: "y".
- bg
background color of the graphical window. By default (
NULL), background is transparent.- plot.contour
logical; If
TRUE, adds contours to plot. Default:FALSE.- ...
additional arguments for the function plot.
Examples
data(skjepo)

plotmomo.env(skjepo$env)