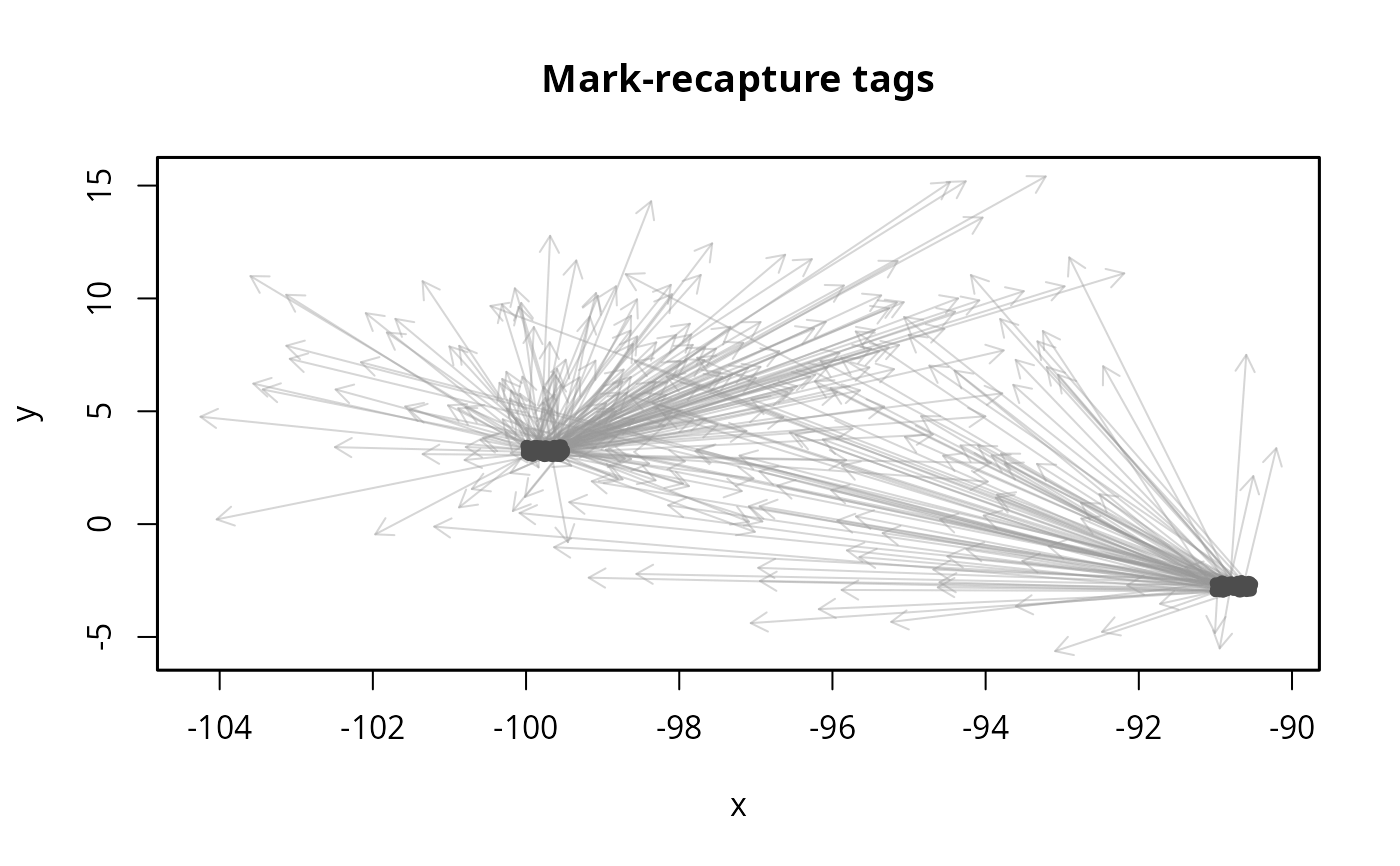
Plot mark-recapture tags as arrows between release and recapture positions.
Usage
plotmomo.ctags(
  x,
  main = "Mark-recapture tags",
  plot.land = FALSE,
  keep.gpar = FALSE,
  xlim = NULL,
  ylim = NULL,
  add = FALSE,
  xlab = "x",
  ylab = "y",
  bg = NULL,
  ...
)
Arguments
- x
a dataframe with mark-recapture tags or a list of class
momo.data,momo.sim, ormomo.fit.- main
a main title for the plot. Default: "Mark-recapture tags".
- plot.land
logical; If
TRUE, plot land masses using the function maps::map. Default:FALSE.- keep.gpar
logical; If
TRUE, do not overwrite the graphical parameters. Default:FALSE.- xlim
the x limits (x1, x2) of the plot. Note that "x1 > x2" is allowed and leads to a "reversed axis". The default value,
NULL, indicates that the range of the finite values to be plotted should be used.- ylim
the y limits of the plot.
- add
logical; if
TRUE, no new graphical window is created and tags are added to existing graphical window. Default:FALSE.- xlab
a label for the x axis. Default: "x".
- ylab
a label for the y axis. Default: "y".
- bg
background color of the graphical window. By default (
NULL), background is transparent.- ...
additional arguments for the function plot.
Examples
data(skjepo)

plotmomo.ctags(skjepo$ctags)