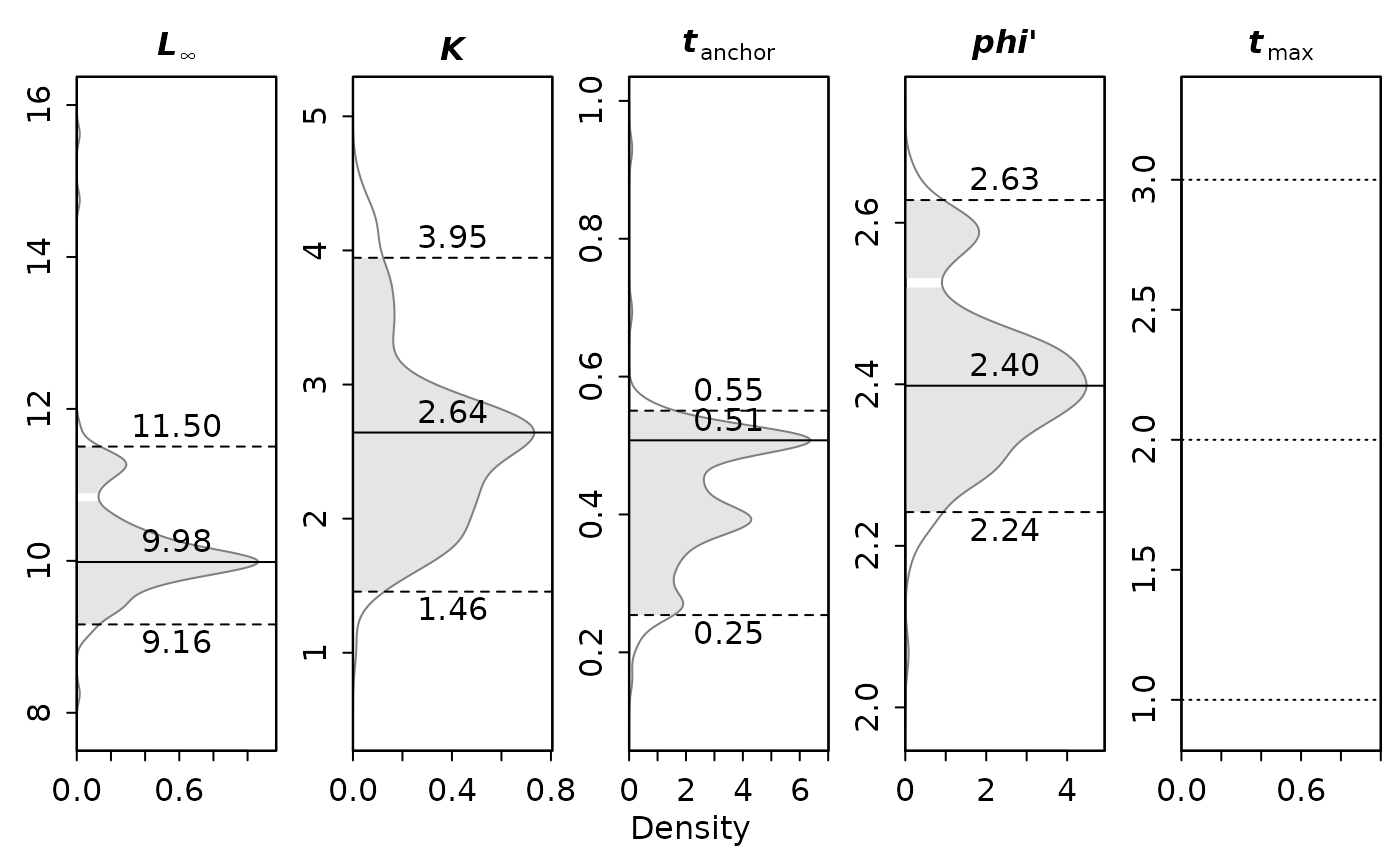
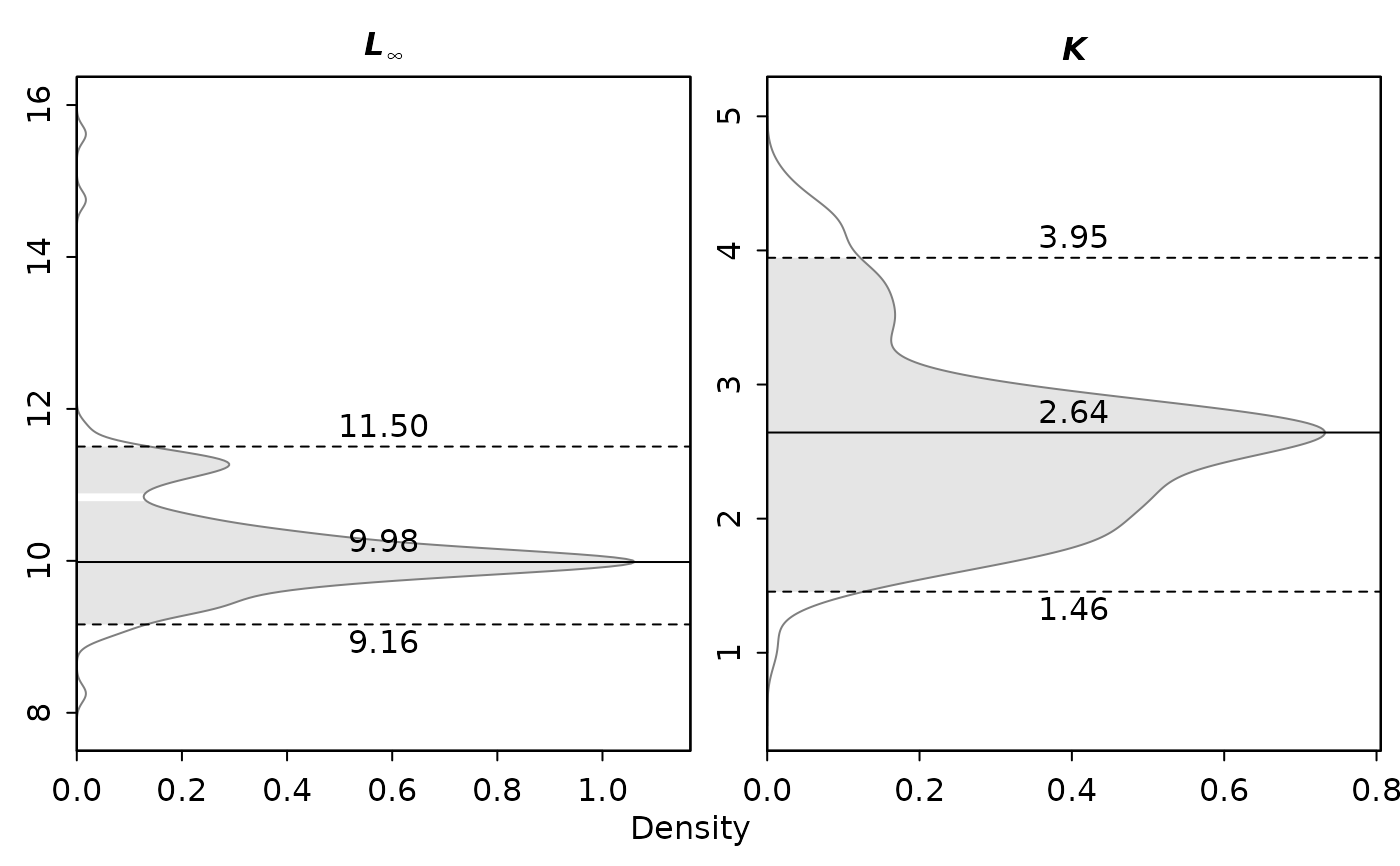
Univariate density plots of bootstrapping results
Source:R/univariate_density.R
univariate_density.RdPlots the univariate kernel density estimates of the VBGF parameters from bootstrapping results (ELEFAN_GA_boot, ELEFAN_SA_boot) and of the following assessment steps (see the argument `boot` of M_empirical, catchCurve, VPA and predict_mod) together with the confidence interval and the parameter value with maximum density (mode of the kernel density).
Usage
univariate_density(
  res,
  CI = 95,
  use_hist = FALSE,
  nbreaks = 10,
  truePar = NA,
  display_val = TRUE,
  display_median = FALSE,
  display_legend = FALSE,
  display_rugs = FALSE,
  mar = c(1.5, 2, 2, 0),
  oma = c(1.5, 0, 0, 0.5),
  mgp = c(2, 0.5, 0),
  tcl = -0.25,
  cex = 1,
  mfrow = NA,
  ylim = NA,
  pars = NULL,
  ...
)
Arguments
- res
list of class `lfqBoot`
- CI
numeric. Confidence interval level (Default: 95)
- use_hist
logical. Plot histogram in addition to smoothed kernel density.
- nbreaks
numeric. Number of breaks in the histogram.
- truePar
if true parameters known lines can be added to graph
- display_val
logical. Should the values of the CI limits and maximum density be displayed (Default: `TRUE`)?
- display_median
logical. Should the median be displayed (Default: `FALSE`)?
- display_legend
logical. Should a legend be displayed (Default: `FALSE`)?
- display_rugs
logical. Should the individual estimates be displayed as rugs (Default: `FALSE`)?
- mar
vector. Inner margins settings. See `?par`.
- oma
vector. Outer margins settings.See `?par`.
- mgp
vector. See `?par`.
- tcl
vector. See `?par`.
- cex
numeric. See `?par`.
- mfrow
vector. See `?par` (default: NA).
- ylim
optional list with y-axis limits, one vector per parameter (Default: NA).
- pars
optional; names of the columns in `res$bootRaw` (parameters) to be plotted. Default (`NULL`): all columns.
- ...
Additional arguments passed to `par`.