
`ELEFAN_SA_boot` performs a bootstrapped fitting of the von Bertalanffy growth function (VBGF) via the ELEFAN_SA function. The length-frequency data is resampled `nresamp` times with lfqResample and ELEFAN_SA is fitted to each resampled data set. Most of the arguments are simply passed to ELEFAN_SA.
Usage
ELEFAN_SA_boot(
  lfq,
  seasonalised = FALSE,
  init_par = list(Linf = 50, K = 0.5, t_anchor = 0.5, C = 0, ts = 0),
  low_par = NULL,
  up_par = NULL,
  parallel = FALSE,
  nresamp = 200,
  no_cores = max(1, parallel::detectCores() - 1, na.rm = TRUE),
  clusterType = "PSOCK",
  outfile = NULL,
  SA_time = 60,
  SA_temp = 1e+05,
  maxit = NULL,
  MA = 5,
  addl.sqrt = FALSE,
  agemax = NULL,
  flagging.out = TRUE,
  seed = NULL,
  CI = 95
)
Arguments
- lfq
a length frequency object of the class `lfq`
- seasonalised
logical; indicating if the seasonalised von Bertalanffy growth function should be applied (default: FALSE).
- init_par
a list providing the Initial values for the components to be optimized. When set to NULL the following default values are used:
Linf length infinity in cm (default is the maximum length class in the data),
K curving coefficient (default: 0.5),
t_anchor time point anchoring growth curves in year-length coordinate system, corrsponds to peak spawning month (range: 0 to 1, default: 0.5),
C amplitude of growth oscillation (range: 0 to 1, default: 0),
ts summer point (ts = WP - 0.5) (range: 0 to 1, default: 0);
- low_par
a list providing the minimum of the search space in case of real-valued or permutation encoded optimizations. When set to NULL the following default values are used:
Linf length infinity in cm (default is calculated from maximum length class in the data),
K curving coefficient (default: 0.01),
t_anchor time point anchoring growth curves in year-length coordinate system, corrsponds to peak spawning month (range: 0 to 1, default: 0),
C amplitude of growth oscillation (range: 0 to 1, default: 0),
ts summer point (ts = WP - 0.5) (range: 0 to 1, default: 0);
- up_par
a list providing the maximum of the search space in case of real-valued or permutation encoded optimizations. When set to NULL the following default values are used:
Linf length infinity in cm (default is calculated from maximum length class in the data),
K curving coefficient (default: 1),
t_anchor time point anchoring growth curves in year-length coordinate system, corrsponds to peak spawning month (range: 0 to 1, default: 1),
C amplitude of growth oscillation (range: 0 to 1, default: 1),
ts summer point (ts = WP - 0.5) (range: 0 to 1, default: 1);
- parallel
logical; should the resamples be fitted in parallel? TropFishR has to be installed for the parallel version, because each worker loads it. Depending on the operating system, the argument `clusterType` can be adjusted. (Default: `parallel = FALSE`)
- nresamp
numeric; the number of resamples (Default: `nresamp = 200`)
- no_cores
numeric; number of cores used if `parallel = TRUE` (Default: one less than the number of available cores)
- clusterType
type of cluster, see
makeCluster(Default: `clusterType = "PSOCK"`)- outfile
character; optional name of a text file, which records the progress of the resample completions. The file is overwritten. (Default: `outfile = NULL`, no file is written)
- SA_time
numeric; Maximum running time in seconds (default : 60 * 1).
- SA_temp
numeric; Initial value for temperature (default : 1e5).
- maxit
numeric; default: maxit = NULL.
- MA
number indicating over how many length classes the moving average should be performed (default: 5, for more information see lfqRestructure)
- addl.sqrt
additional squareroot transformation of positive values according to Brey et al. (1988) (default: FALSE, for more information see lfqRestructure)
- agemax
maximum age of species; default NULL, then estimated from Linf
- flagging.out
logical; should positive peaks be flagged out? Original setting of ELEFAN in TRUE. Default:TRUE
- seed
seed value for random number reproducibility. Resample `x` uses the seed `seed + x`. (Default: NULL, a random seed is drawn)
- CI
percentage for confidence intervals (Default: 95)
Value
an object of class `lfqBoot`, see ELEFAN_GA_boot.
References
Schwamborn, R., Mildenberger, T. K., Taylor, M. H., 2019. Assessing sources of uncertainty in length-based estimates of body growth in populations of fishes and macroinvertebrates with bootstrapped ELEFAN. Ecological Modelling, 393, 37-51
Examples
# \donttest{
# load data
data(alba)
# settings
MA <- 7
init_par <- list(Linf = 10, K = 1, t_anchor = 0.5)
low_par <- list(Linf = 8, K = 0.1, t_anchor = 0)
up_par <- list(Linf = 15, K = 5, t_anchor = 1)
SA_time <- 1 # far too short for a real analysis
SA_temp <- 1e5
nresamp <- 10
res <- ELEFAN_SA_boot(lfq = alba, MA = MA, seasonalised = FALSE,
init_par = init_par, up_par = up_par, low_par = low_par,
SA_time = SA_time, SA_temp = SA_temp, seed = 1,
nresamp = nresamp
)
#> Simulated annealing is running.
#> This will take approximately 0.02 minutes.
#> Simulated annealing is running.
#> This will take approximately 0.02 minutes.
#> Simulated annealing is running.
#> This will take approximately 0.02 minutes.
#> Simulated annealing is running.
#> This will take approximately 0.02 minutes.
#> Simulated annealing is running.
#> This will take approximately 0.02 minutes.
#> Simulated annealing is running.
#> This will take approximately 0.02 minutes.
#> Simulated annealing is running.
#> This will take approximately 0.02 minutes.
#> Simulated annealing is running.
#> This will take approximately 0.02 minutes.
#> Simulated annealing is running.
#> This will take approximately 0.02 minutes.
#> Simulated annealing is running.
#> This will take approximately 0.02 minutes.
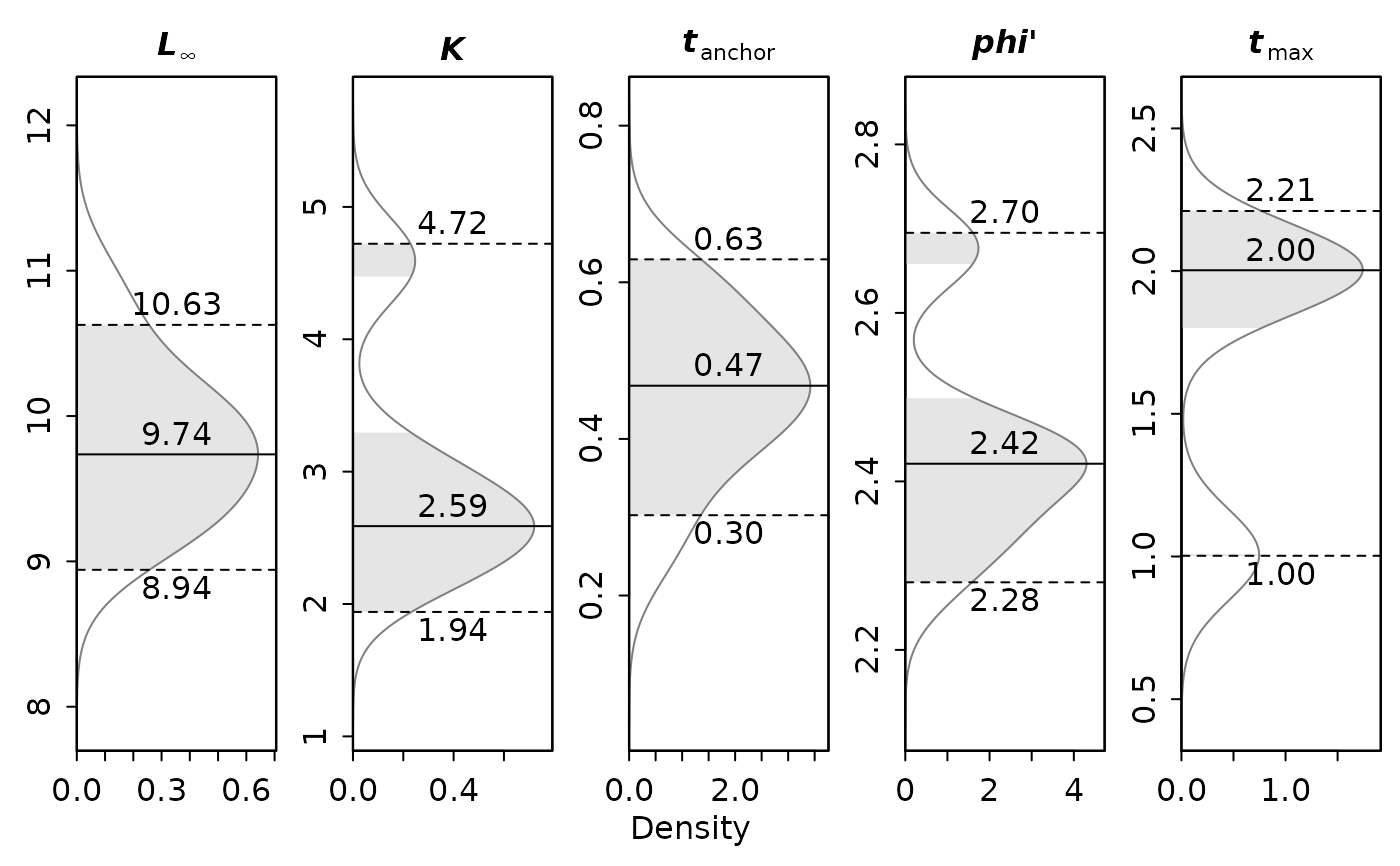
res$maxDen
#> Linf K t_anchor phiL agemax
#> 9.7758712 2.9429078 0.4813687 2.4490876 2.0000000
res$CI
#> Linf K t_anchor phiL agemax
#> lo 9.180246 2.173960 0.2777088 2.290667 1
#> up 10.769992 4.651573 0.6015376 2.679978 2
# plot resulting distributions
univariate_density(res)
 # }