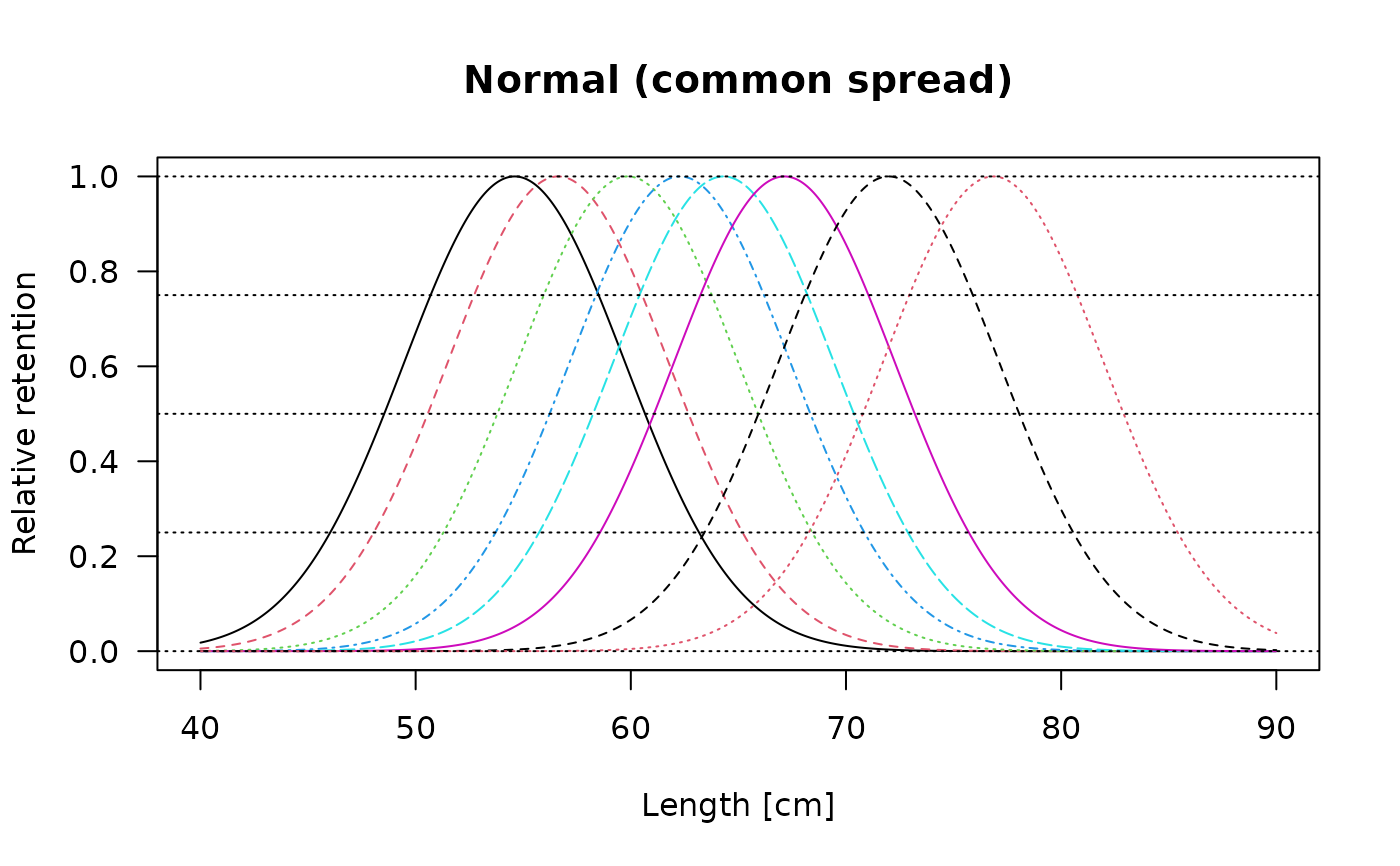
This function plots the selectivity estimates of Millar's
selectivity model (select_Millar).
Usage
# S3 method for class 'select_Millar'
plot(
  x,
  plotlens = NULL,
  standardise = TRUE,
  deviance_plot = TRUE,
  selectivity_plot = TRUE,
  xlab_dev = "Length [cm]",
  xlab_sel = "Length [cm]",
  ylab_dev = "Mesh size [cm]",
  ylab_sel = "Relative retention",
  title_dev = "Deviance residuals",
  title_sel = NULL,
  ...
)
Arguments
- x
a list of the class
"select_Millar"containing the results of Millar's selectivity model- plotlens
A vector with lengths which should be used for drawing the selection curves
- standardise
A parameter indicating if the retention should be realtive to the maximum value (Default: TRUE).
- deviance_plot
logical (Default: TRUE); indicating whether a plot of deviance residuals should be displayed
- selectivity_plot
logical (Default: TRUE); indicating whether a plot of relative retention selectivities should be displayed
- xlab_dev
character string. Label for x axis of deviance plot. Default: "Length [cm]"
- xlab_sel
character string. Label for x axis of selectivity plot. Default: "Length [cm]"
- ylab_dev
character string. Label for y axis of deviance plot. Default: "Mesh size [cm]"
- ylab_sel
character string. Label for y axis of selectivity plot. Default: "Relative retention".
- title_dev
character string. Label for main title of deviance plot. Default: "Deviance residuals".
- title_sel
character string. Label for main title of selectivity plot. Default is taken from the results of the select_Millar (e.g. res$rtype).
- ...
additional parameter options from plot function
Details
This function draws a selectivity plot for the object class
"select_Millar", which is created by applying Millar's selectivity model
select_Millar.