
This function plots the recruitment patterns from the recruitment model.
Usage
# S3 method for class 'recruitment'
plot(
  x,
  percent = TRUE,
  col = "darkgreen",
  xtitle = "default",
  ytitle = "default",
  ...
)
Arguments
- x
list of the class
"recruitment"- percent
logical; should number of recruits be relative (percentage)?
- col
colour of bars (default is "darkgreen")
- xtitle
title of x axis (default "rel. months" or no title, respectively)
- ytitle
title of y axis (default "# Recruits" or "Recruits [%]", respectively)
- ...
standard parameters of
barplot
References
Sparre, P., Venema, S.C., 1998. Introduction to tropical fish stock assessment. Part 1. Manual. FAO Fisheries Technical Paper, (306.1, Rev. 2). 407 p.
Examples
dat <- list(midLengths = seq(2,98,4),
catch = c(0.6,17.6,93,83.2,12.6,0.3,0,0,0,1,17.1,51.4,
26.1,2.2,0.2,4.5,21.6,17.6,3.7,8.7,10.6,6.3,5.6,2.9,0.8),
Linf = 100,
K = 0.5)
output <- recruitment(param = dat, tsample = 0.25)
plot(output, percent = FALSE)
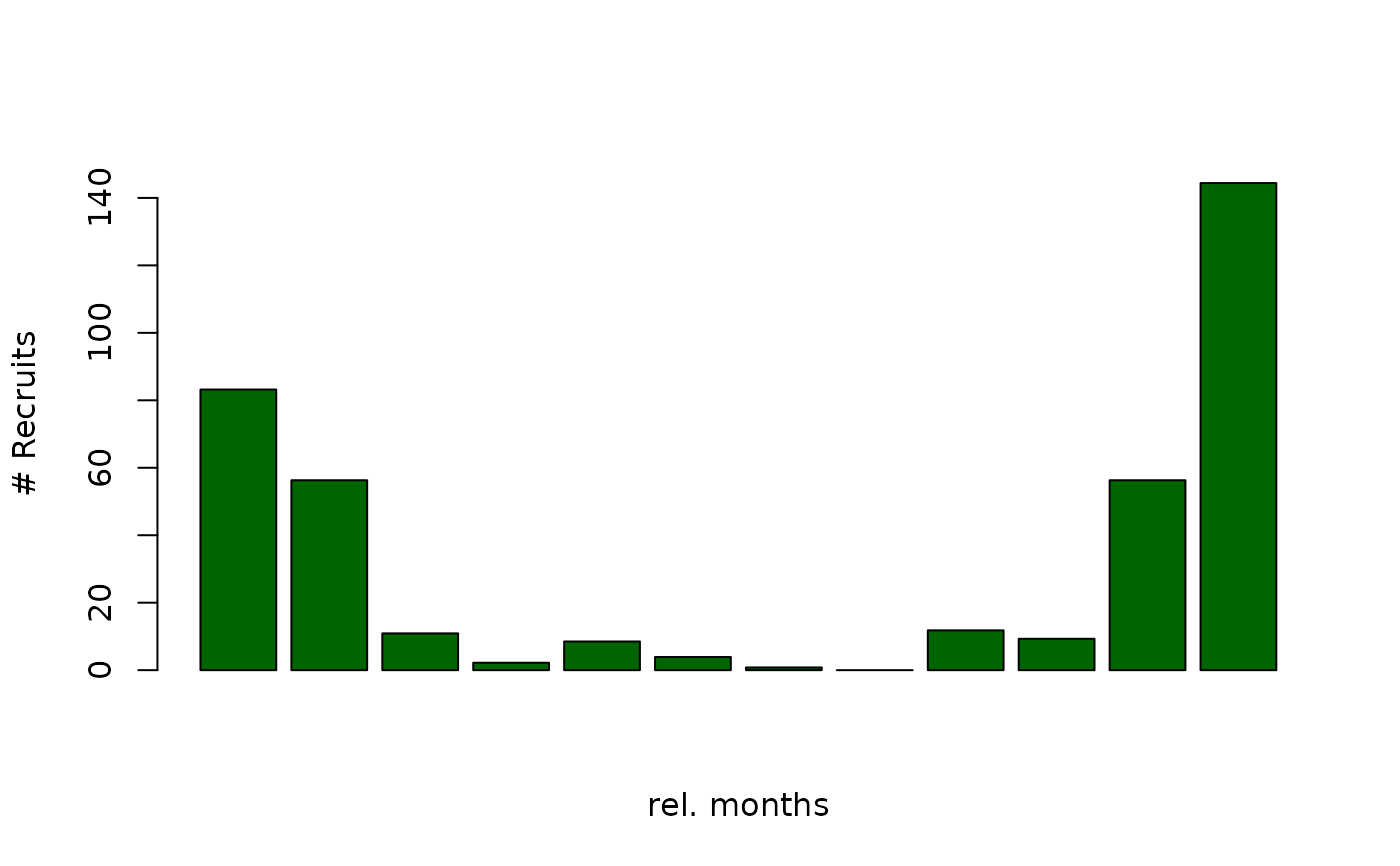 #> If no t0 is provided only relative recruitment pattern can be estimated.