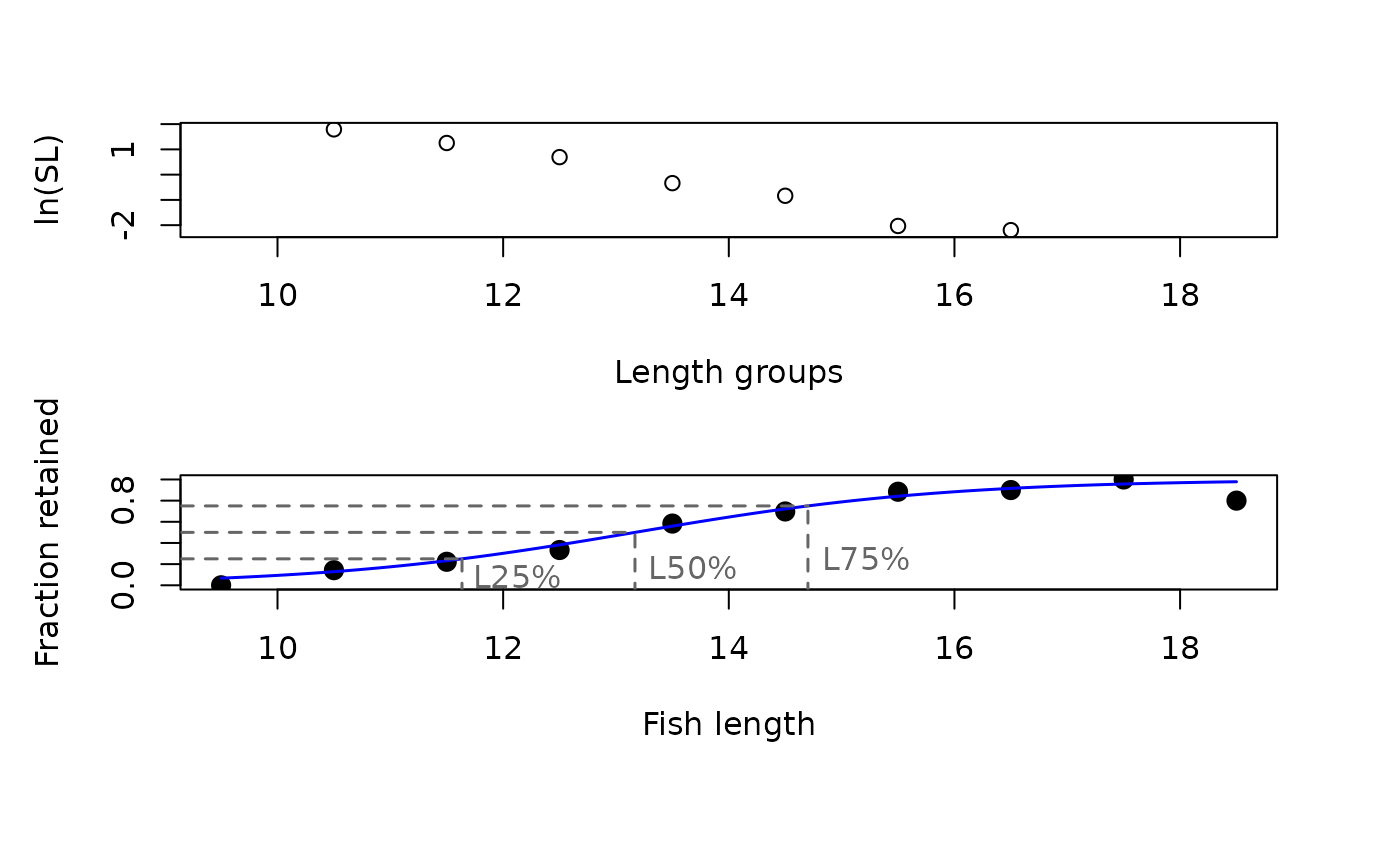
This function plots the selectivity estimates of the
function select.
Usage
# S3 method for class 'select'
plot(x, regression_fit = TRUE, cols = c("darkgreen", "orange"), ...)
Arguments
- x
a list of the class "select" containing the results of the
gillnet selectivity function.
- regression_fit
logical; indicating if a plot with the fit of the regression
line should be displayed
- cols
a specification for the two colours of the two selection curves.
Default is c("darkgreen","orange").
- ...
additional parameters of the plot function
References
Sparre, P., Venema, S.C., 1998. Introduction to tropical fish stock assessment.
Part 1. Manual. FAO Fisheries Technical Paper, (306.1, Rev. 2). 407 p.
Examples
data(tilapia)
output <- select(tilapia, plot = FALSE)
plot(output, regression_fit = TRUE)
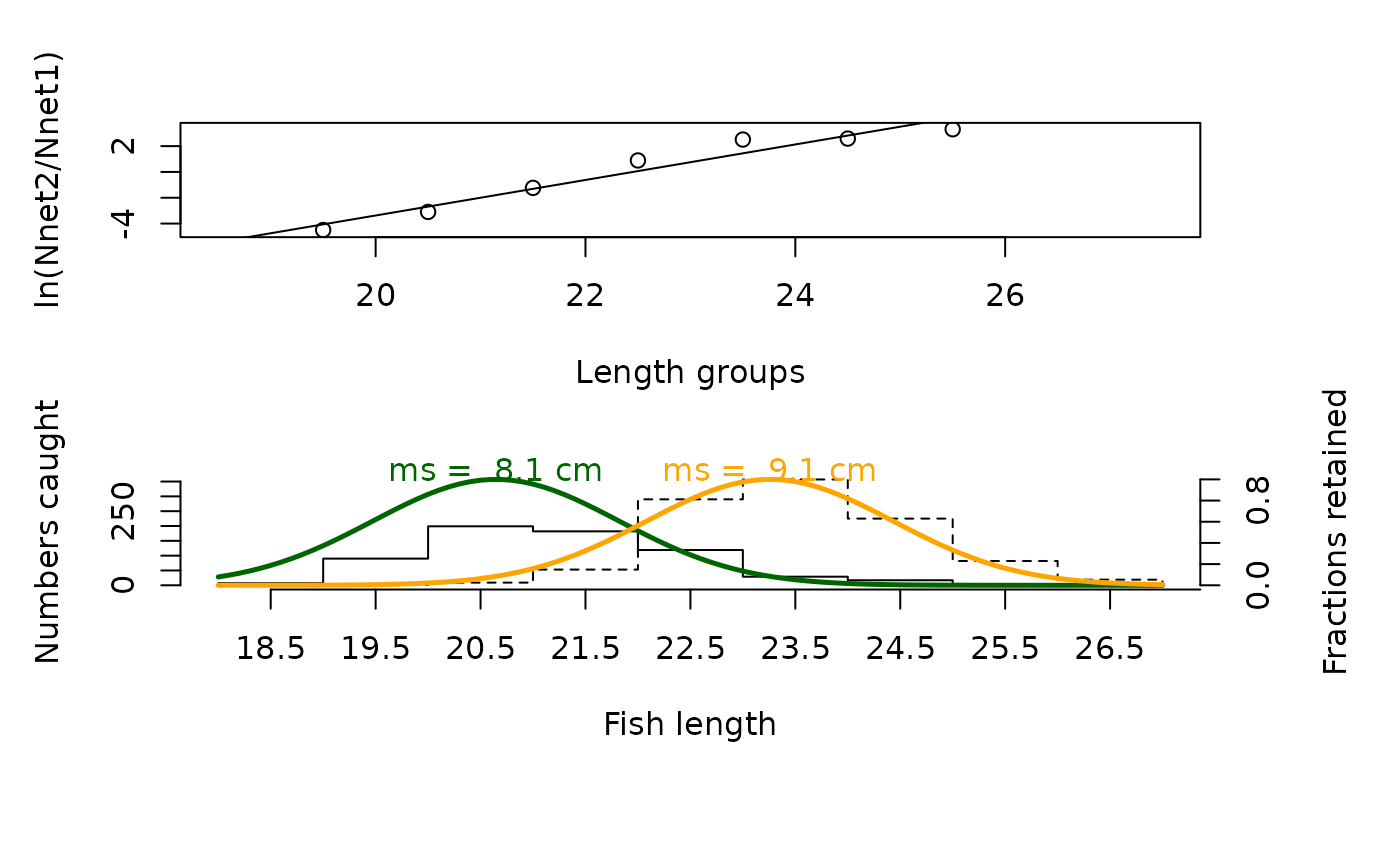 data(bream)
output <- select(bream, plot = FALSE)
plot(output, regression_fit = TRUE)