
This function plots the results from the catchCurve model.
Arguments
- x
A list of the class
"catchCurve"containing the results of the catchCurve model.- xaxis
Character defining if x axis should represent length or age (default: 'age')
- plot_selec
logical; if TRUE the regression line is plotted for not fully exploited length groups and the probability of capture is plotted. This only works if the catchCurve was applied with
calc_ogive== TRUE.- col
a specification for colour of regression points, line and annotation
- cex
a numerical value giving the amount by which plotting text and symbols should be magnified relative to the default.
- xlim
limits of x axis
- ylim
limits of y axis
- xlab
label of x axis. Default display by setting to "default".
- ylab
label of y axis. Default display by setting to "default".
- ...
standard parameters of plot function
References
Sparre, P., Venema, S.C., 1998. Introduction to tropical fish stock assessment. Part 1. Manual. FAO Fisheries Technical Paper, (306.1, Rev. 2). 407 p.
Examples
# \donttest{
data(synLFQ3)
output <- catchCurve(synLFQ3, calc_ogive = TRUE, reg_int = c(9,21))
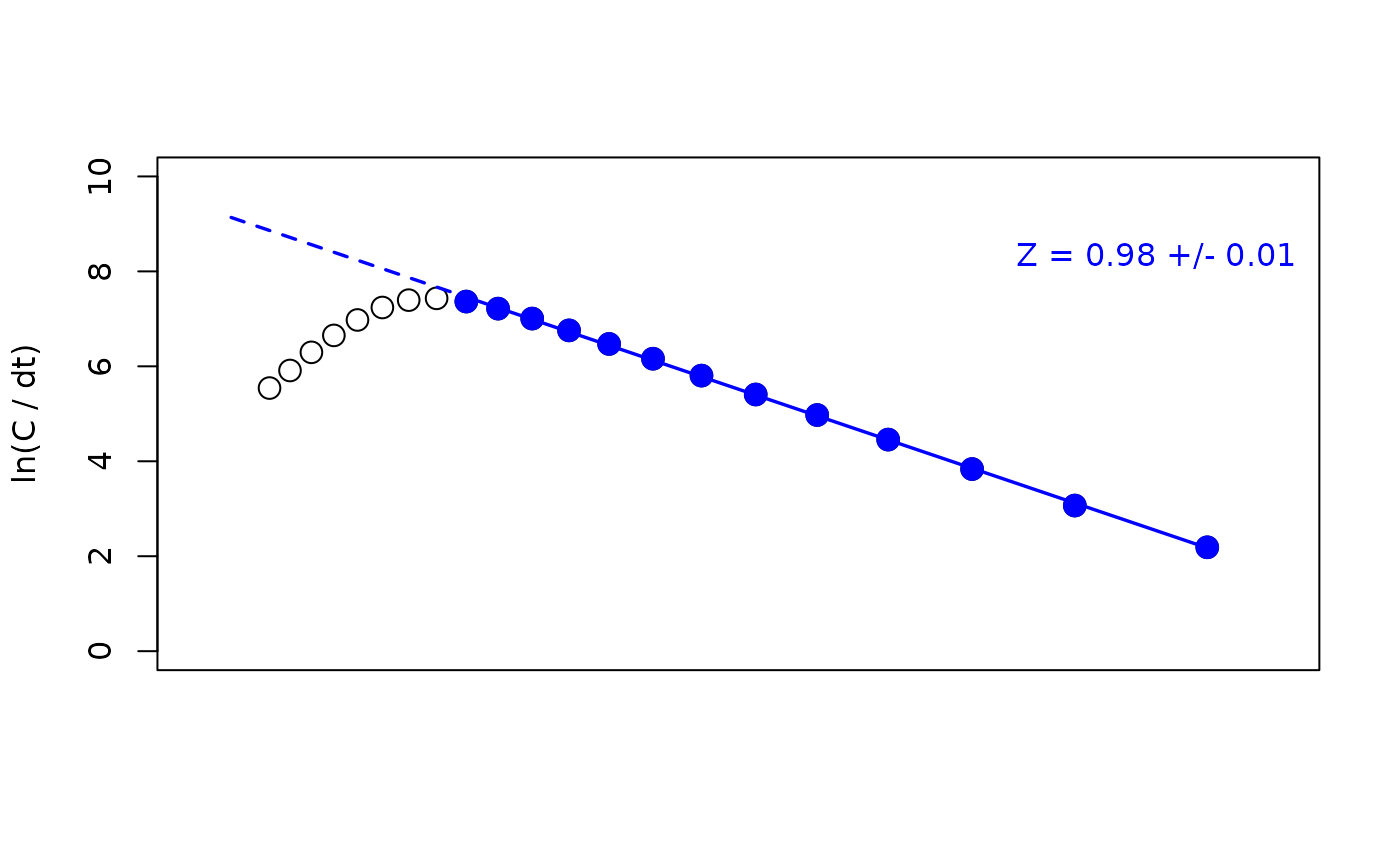
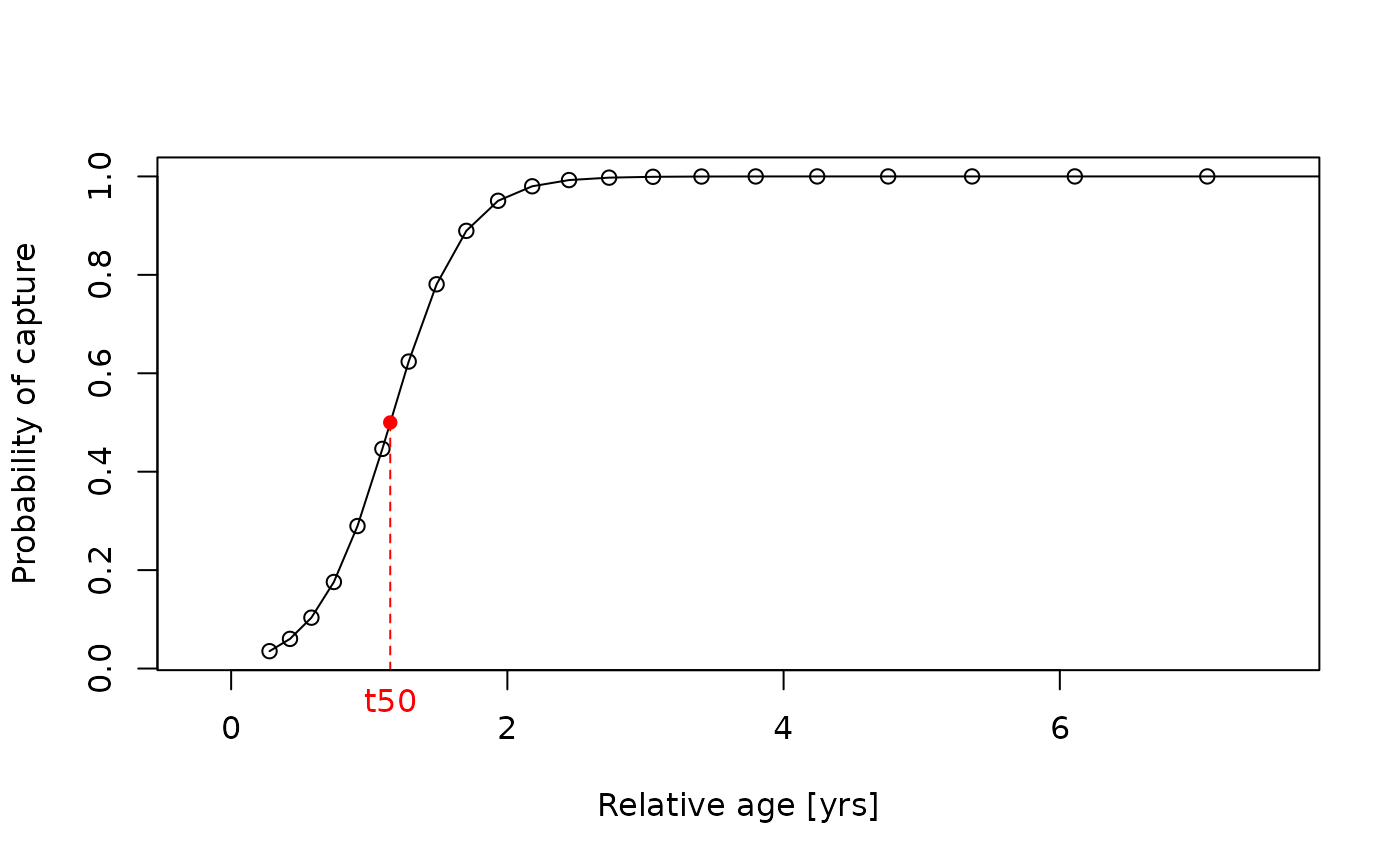 plot(output, plot_selec = TRUE)
 # }