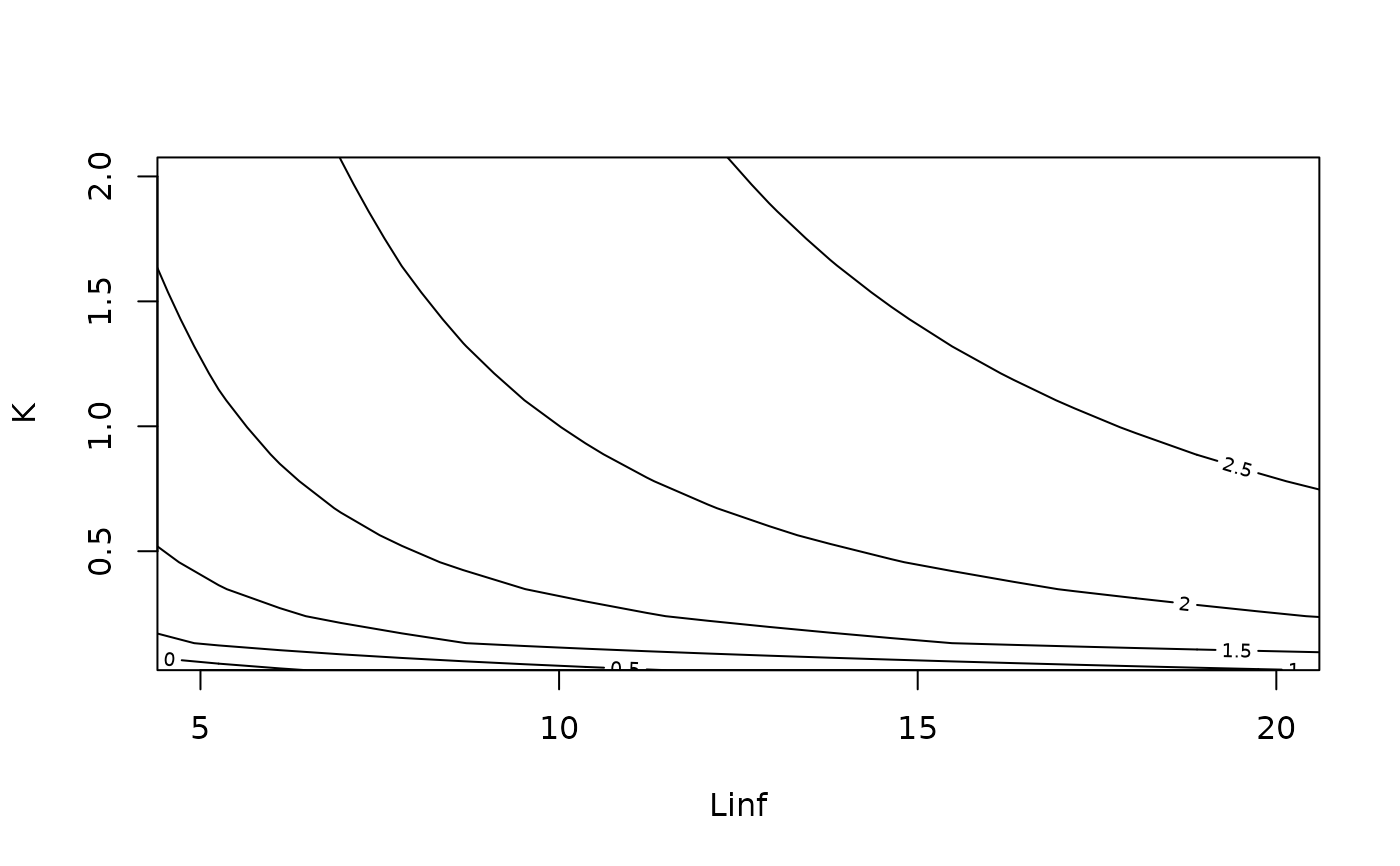
Adds isolines of the growth performance index \(\phi' = \log_{10}(K) + 2 \log_{10}(L_\infty)\) to an existing plot with Linf on the x-axis and K on the y-axis (e.g. LinfK_scatterhist).
Arguments
- gridsize
default = 20
- ...
Additional arguments passed to
contour.