
Electronic LEngth Frequency ANalysis for estimating growth parameter.
Usage
ELEFAN(
  lfq,
  Linf_fix = NA,
  Linf_range = NA,
  K_range = exp(seq(log(0.1), log(10), length.out = 100)),
  C = 0,
  ts = 0,
  MA = 5,
  addl.sqrt = FALSE,
  agemax = NULL,
  flagging.out = TRUE,
  method = "optimise",
  cross.date = NULL,
  cross.midLength = NULL,
  cross.max = FALSE,
  hide.progressbar = FALSE,
  plot = FALSE,
  contour = FALSE,
  add.values = TRUE,
  rsa.colors = terrain.colors(20),
  plot_title = TRUE,
  plot.score = TRUE
)
Arguments
- lfq
a list consisting of following parameters:
midLengths midpoints of the length classes,
dates dates of sampling times (class Date),
catch matrix with catches/counts per length class (row) and sampling date (column);
- Linf_fix
numeric; if used the K-Scan method is applied with a fixed Linf value (i.e. varying K only).
- Linf_range
numeric vector with potential Linf values. Default is the last length class plus/minus 5 cm
- K_range
K values for which the score of growth functions should be calculated (by default: exp(seq(log(0.1),log(10),length.out = 100)))
- C
growth oscillation amplitude (default: 0)
- ts
onset of the first oscillation relative to t0 (summer point, default: 0)
- MA
number indicating over how many length classes the moving average should be performed (default: 5, for more information see lfqRestructure).
- addl.sqrt
Passed to lfqRestructure. Applied an additional square-root transformation of positive values according to Brey et al. (1988). (default: FALSE, for more information see lfqRestructure).
- agemax
maximum age of species; default NULL, then estimated from Linf
- flagging.out
logical; should positive peaks be flagged out? (Default : TRUE)
- method
Choose between the old FiSAT option to force VBGF crossing of a pre-defined bin (method = "cross"), or the more sophisticated (but computationally expensive) option to solve for t_anchor via a maximisation of reconstructed score (default: method = "optimise").
- cross.date
Date. For use with
method = "cross". In combination withcross.midLength, defines the date of the crossed bin.- cross.midLength
Numeric. For use with
method = "cross". In combination withcross.date, defines the mid-length of the crossed bin.- cross.max
logical. For use with
method = "cross". Forces growth function to cross the bin with maximum positive score.- hide.progressbar
logical; should the progress bar be hidden? (default: FALSE)
- plot
logical; indicating if plot with restructured frequencies and growth curves should be displayed
- contour
if used in combination with response surface analysis, contour lines are displayed rather than the score as text in each field of the score plot. Usage can be logical (e.g. TRUE) or by providing a numeric which indicates the number of levels (
nlevelsincontour). By default FALSE.- add.values
logical. Add values to Response Surface Analysis plot (default: TRUE). Overridden when
contour = TRUE.- rsa.colors
vector of colors to be used with the Response Surface Analysis plot. (default: terrain.colors(20))
- plot_title
logical; indicating whether title to score plots should be displayed
- plot.score
logical; Plot the score graph, i.e. the response surface (if
Linf_fix = NA) or the K-scan (ifLinf_fixis provided) (Default: plot.score=TRUE).
Value
A list with the input parameters and following list objects:
rcounts: restructured frequencies,
peaks_mat: matrix with positive peaks with distinct values,
ASP: available sum of peaks, sum of posititve peaks which could be potential be hit by growth curves,
score_mat: matrix with scores for each Linf (only Linf_fix) and K combination,
t_anchor_mat: maximum age of species,
ncohort: number of cohorts used for estimation,
agemax: maximum age of species,
par: a list with the parameters of the von Bertalanffy growth function:
Linf: length infinity in cm,
K: curving coefficient;
t_anchor: time point anchoring growth curves in year-length coordinate system, corrsponds to peak spawning month,
C: amplitude of growth oscillation (if
seasonalised= TRUE),ts: summer point of oscillation (ts = WP - 0.5) (if
seasonalised= TRUE),phiL: growth performance index defined as phiL = log10(K) + 2 * log10(Linf);
Rn_max: highest score value
Details
This functions allows to perform the K-Scan and Response surface
analysis to estimate growth parameters.
It combines the step of restructuring length-frequency data
(lfqRestructure) followed by the fitting of VBGF
curves through the restructured data (lfqFitCurves). K-Scan is a
method used to search for the K
parameter with the best fit while keeping the Linf fixed. In contrast,
with response surface analysis
both parameters are estimated and the fits are displayed in a heatmap.
Both methods use optimise to find the best t_anchor value
for each combination of K and Linf. To find out more about
t_anchor, please refer to the Details description of
lfqFitCurves. The score value Rn_max is comparable with
the score values of the other ELEFAN functions (ELEFAN_SA or
ELEFAN_GA) when other settings are consistent
(e.g. `MA`, `addl.sqrt`, `agemax`, `flagging.out`).
References
Brey, T., Soriano, M., and Pauly, D. 1988. Electronic length frequency analysis: a revised and expanded user's guide to ELEFAN 0, 1 and 2.
Pauly, D. 1981. The relationship between gill surface area and growth performance in fish: a generalization of von Bertalanffy's theory of growth. Meeresforsch. 28:205-211
Pauly, D. and N. David, 1981. ELEFAN I, a BASIC program for the objective extraction of growth parameters from length-frequency data. Meeresforschung, 28(4):205-211
Pauly, D., 1985. On improving operation and use of ELEFAN programs. Part I: Avoiding "drift" of K towards low values. ICLARM Conf. Proc., 13-14
Pauly, D., 1987. A review of the ELEFAN system for analysis of length-frequency data in fish and aquatic invertebrates. ICLARM Conf. Proc., (13):7-34
Pauly, D. and G. R. Morgan (Eds.), 1987. Length-based methods in fisheries research. (No. 13). WorldFish
Pauly, D. and G. Gaschuetz. 1979. A simple method for fitting oscillating length growth data, with a program for pocket calculators. I.C.E.S. CM 1979/6:24. Demersal Fish Cttee, 26 p.
Pauly, D. 1984. Fish population dynamics in tropical waters: a manual for use with programmable calculators (Vol. 8). WorldFish.
Quenouille, M. H., 1956. Notes on bias in estimation. Biometrika, 43:353-360
Somers, I. F., 1988. On a seasonally oscillating growth function. ICLARM Fishbyte 6(1): 8-11.
Sparre, P., Venema, S.C., 1998. Introduction to tropical fish stock assessment. Part 1. Manual. FAO Fisheries Technical Paper, (306.1, Rev. 2): 407 p.
Tukey, J., 1958. Bias and confidence in not quite large samples. Annals of Mathematical Statistics, 29: 614
Tukey, J., 1986. The future of processes of data analysis. In L. V. Jones (Eds.), The Collected Works of John W. Tukey-philosophy and principles of data analysis: 1965-1986 (Vol. 4, pp. 517-549). Monterey, CA, USA: Wadsworth & Brooks/Cole
Examples
# \donttest{
data(alba)
### Response Surface Analysis (varies Linf and K) ###
# 'cross' method (used in FiSAT)
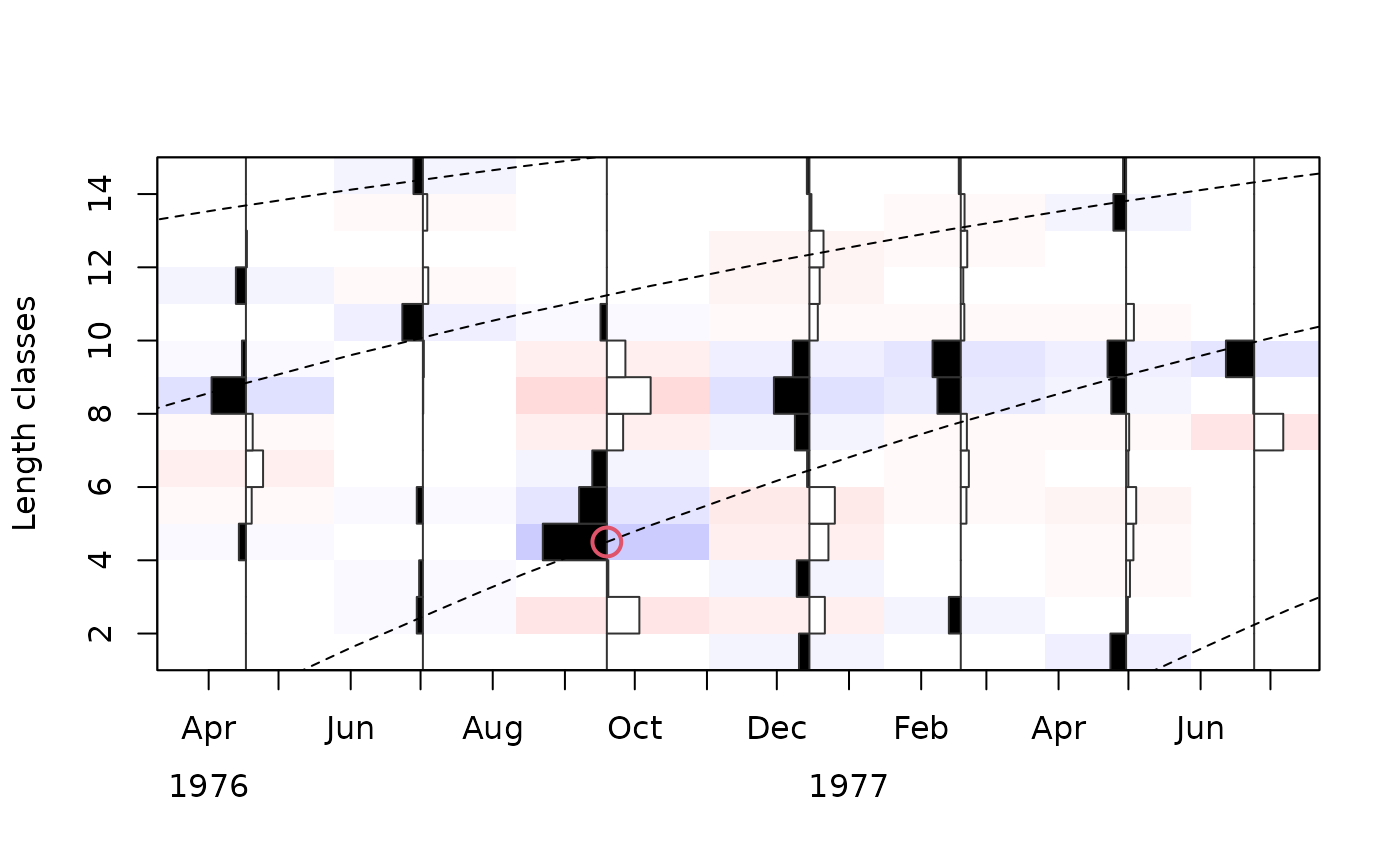
fit1 <- ELEFAN(
lfq = alba, method = "cross",
Linf_range = seq(from = 10, to = 20, length.out = 10),
K_range = exp(seq(from = log(0.1), to = log(2), length.out = 20)),
cross.date = alba$dates[3], cross.midLength = alba$midLengths[4],
contour = TRUE
)
#> Optimisation procedure of ELEFAN is running.
#> This will take some time.
#> The progress bar will inform you about the progress of the calculations.
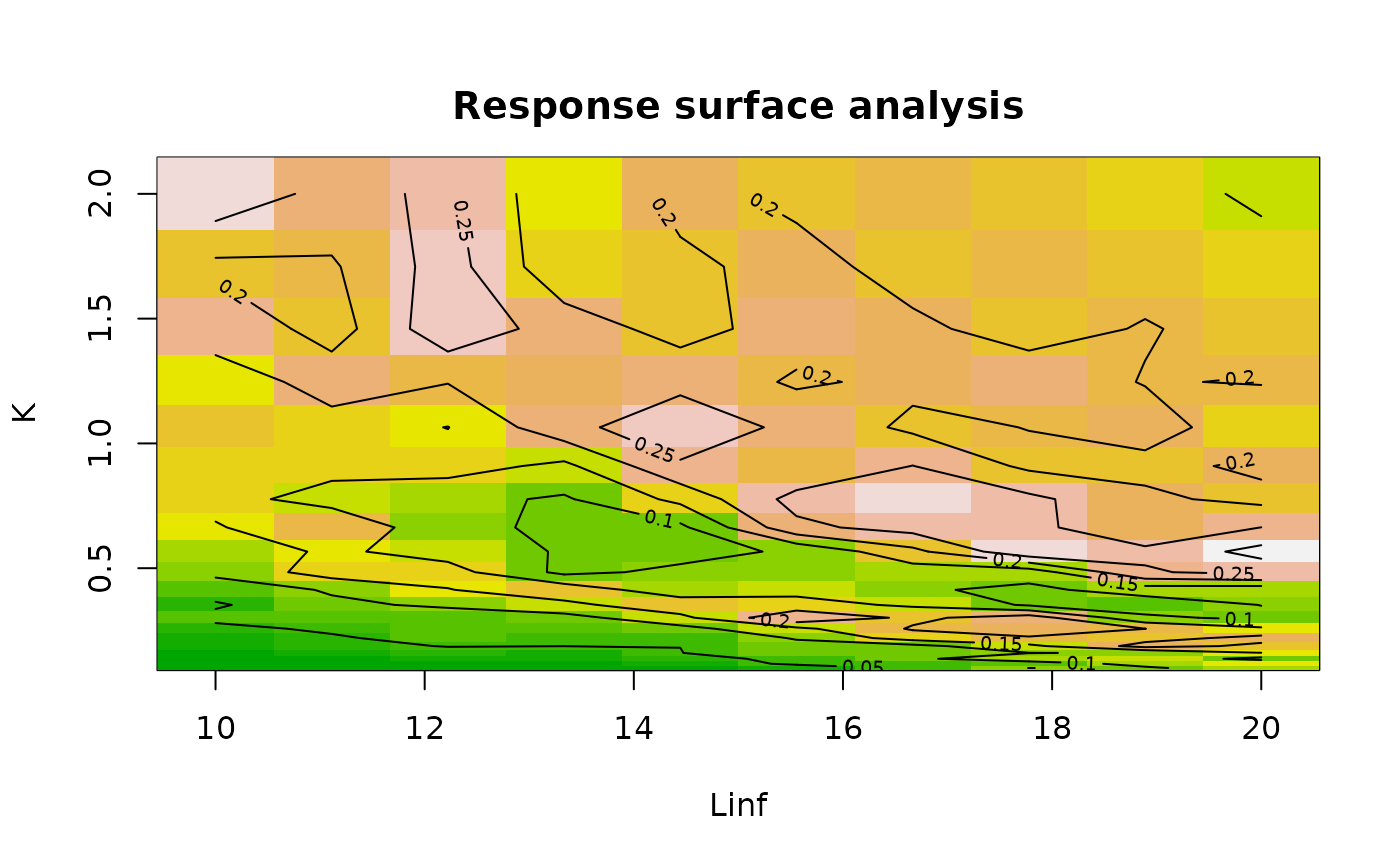 fit1$Rn_max; unlist(fit1$par)
#> [1] 0.318
#> Linf K t_anchor C ts phiL
#> 20.000000 0.570000 0.270000 0.000000 0.000000 2.357935
plot(fit1); points(alba$dates[3], alba$midLengths[4], col=2, cex=2, lwd=2)
 # 'cross' method (bin with maximum score crossed)
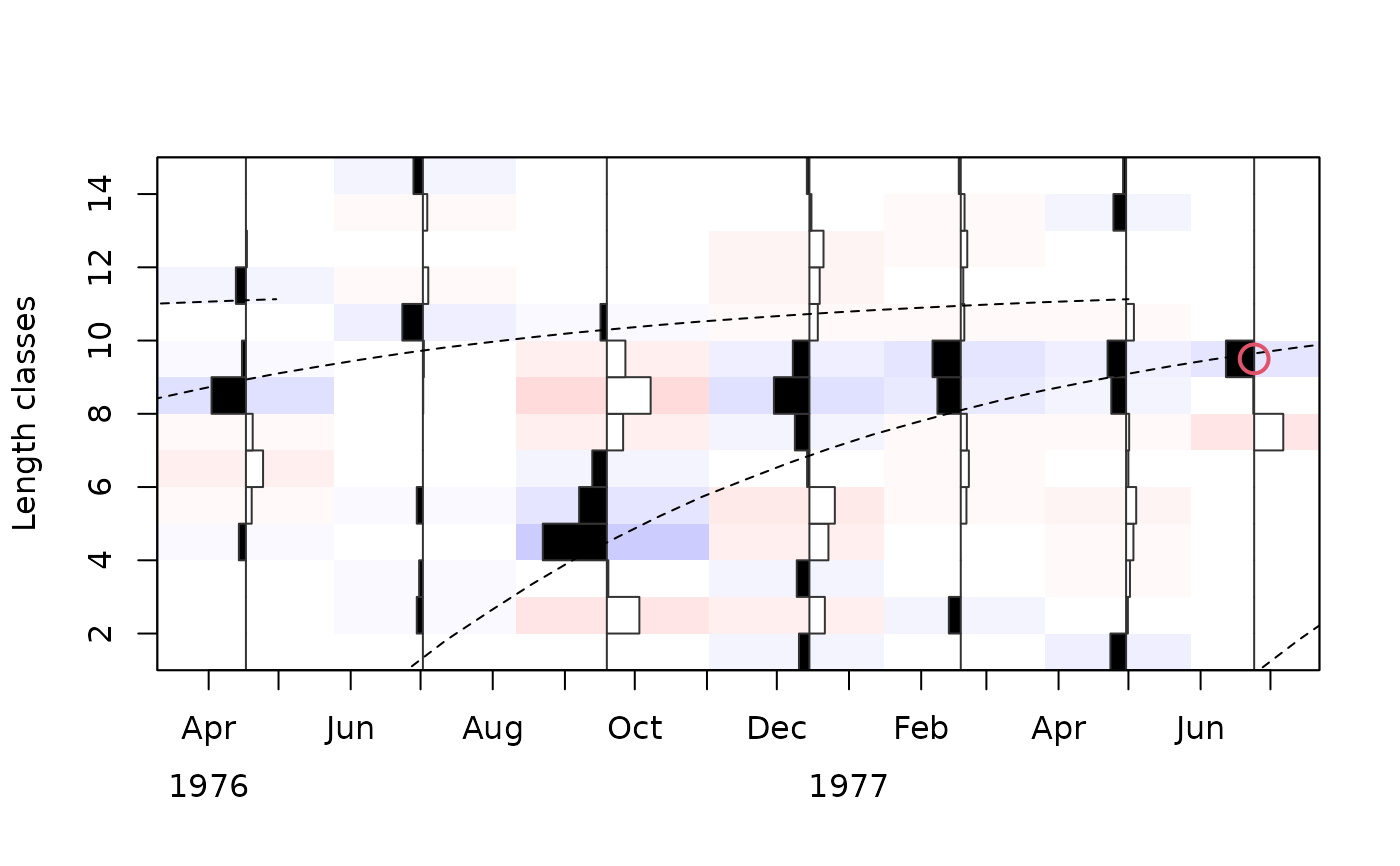
fit2 <- ELEFAN(
lfq = alba, method = "cross",
Linf_range = seq(from = 10, to = 20, length.out = 20),
K_range = exp(seq(from = log(0.1), to = log(2), length.out = 20)),
cross.max = TRUE,
contour = TRUE
)
#> Optimisation procedure of ELEFAN is running.
#> This will take some time.
#> The progress bar will inform you about the progress of the calculations.
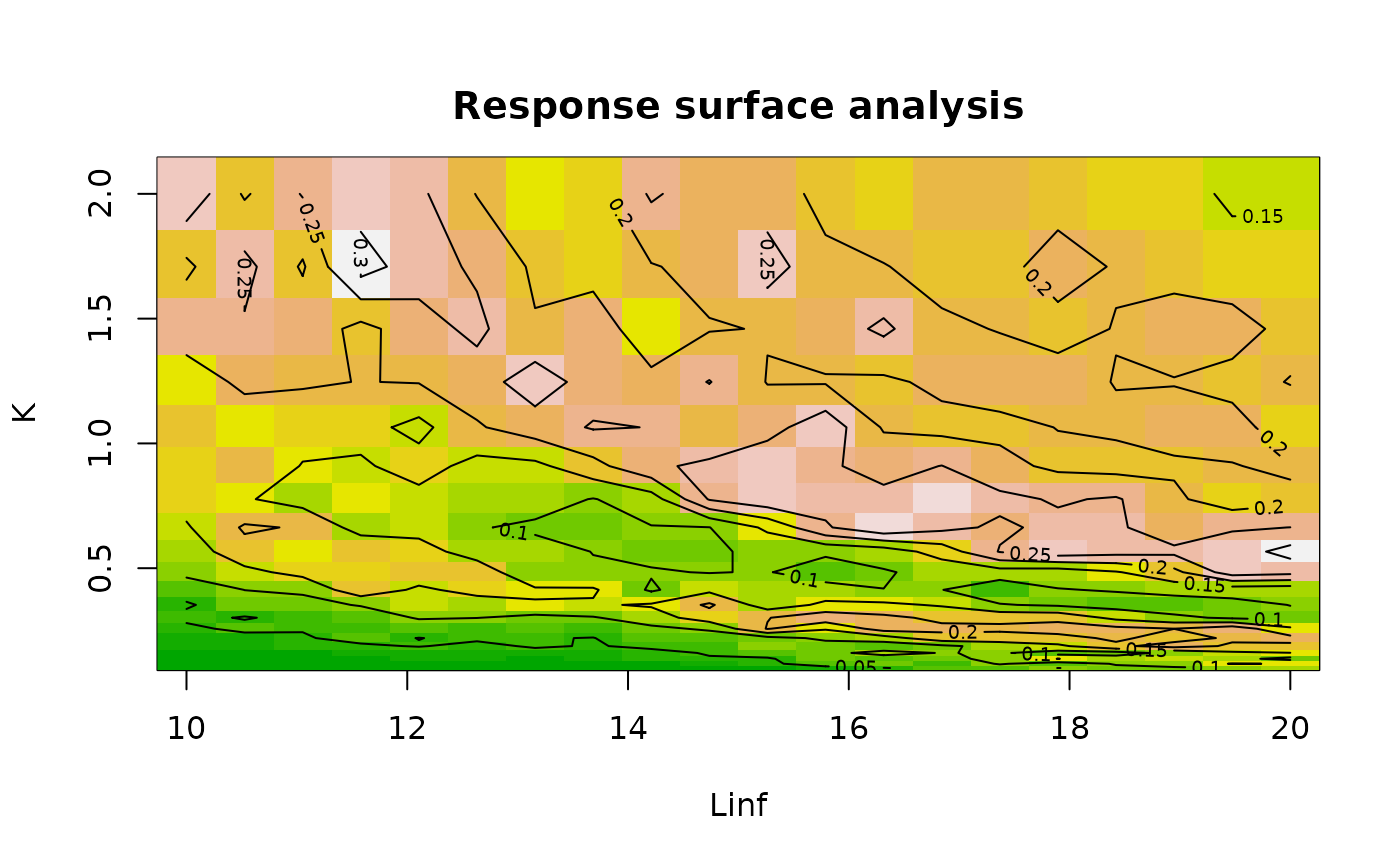 fit2$Rn_max; unlist(fit2$par)
#> [1] 0.323
#> Linf K t_anchor C ts phiL
#> 11.578947 1.710000 0.430000 0.000000 0.000000 2.360334
plot(fit2); points(alba$dates[7], alba$midLengths[9], col=2, cex=2, lwd=2)
 # 'optimise' method (default)
fit3 <- ELEFAN(
lfq = alba, method = "optimise",
Linf_range = seq(from = 10, to = 20, length.out = 10),
K_range = exp(seq(from = log(0.1), to = log(2), length.out = 20)),
contour = TRUE
)
#> Optimisation procedure of ELEFAN is running.
#> This will take some time.
#> The progress bar will inform you about the progress of the calculations.
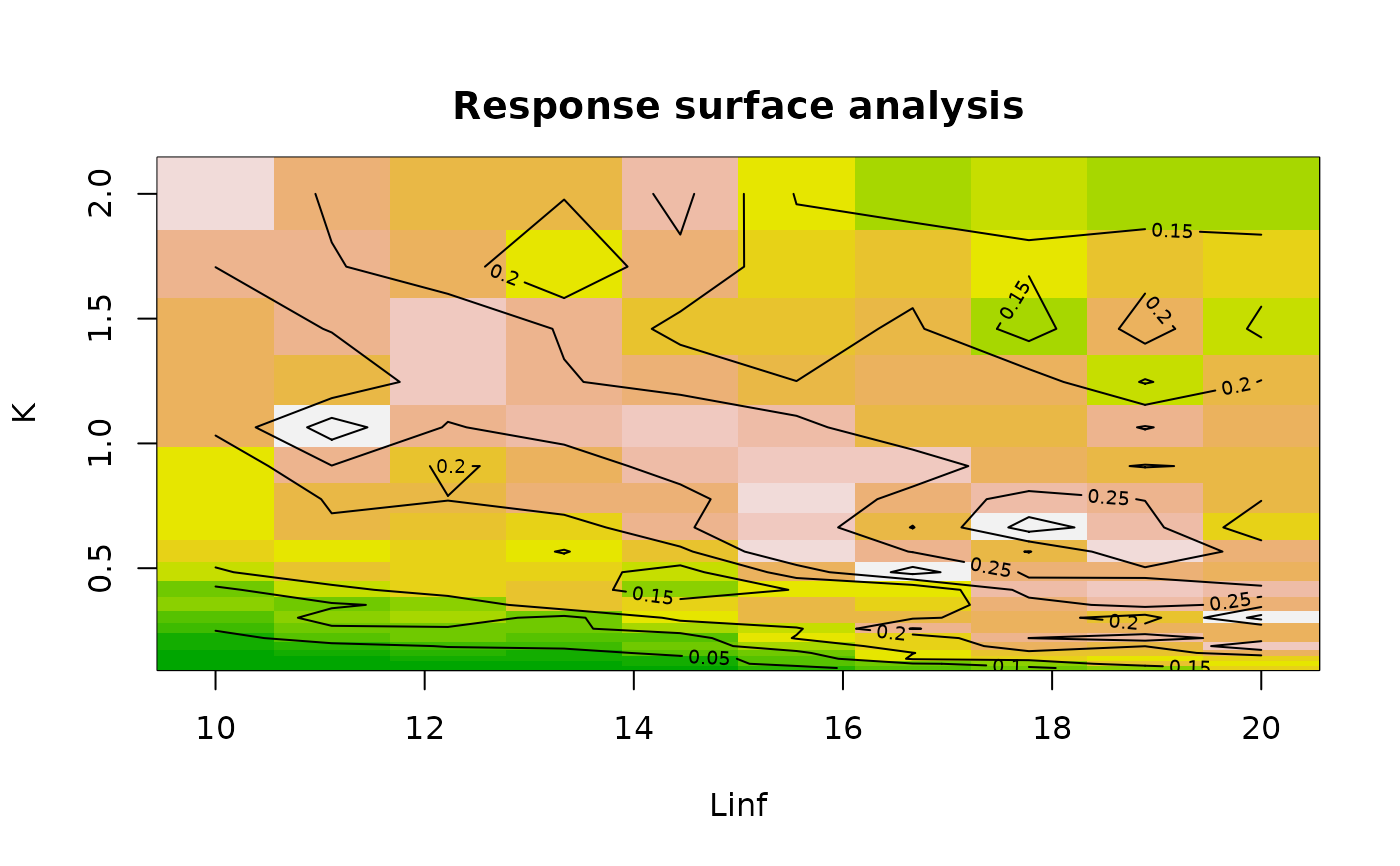 fit3$Rn_max; unlist(fit3$par)
#> [1] 0.324
#> Linf K t_anchor C ts phiL
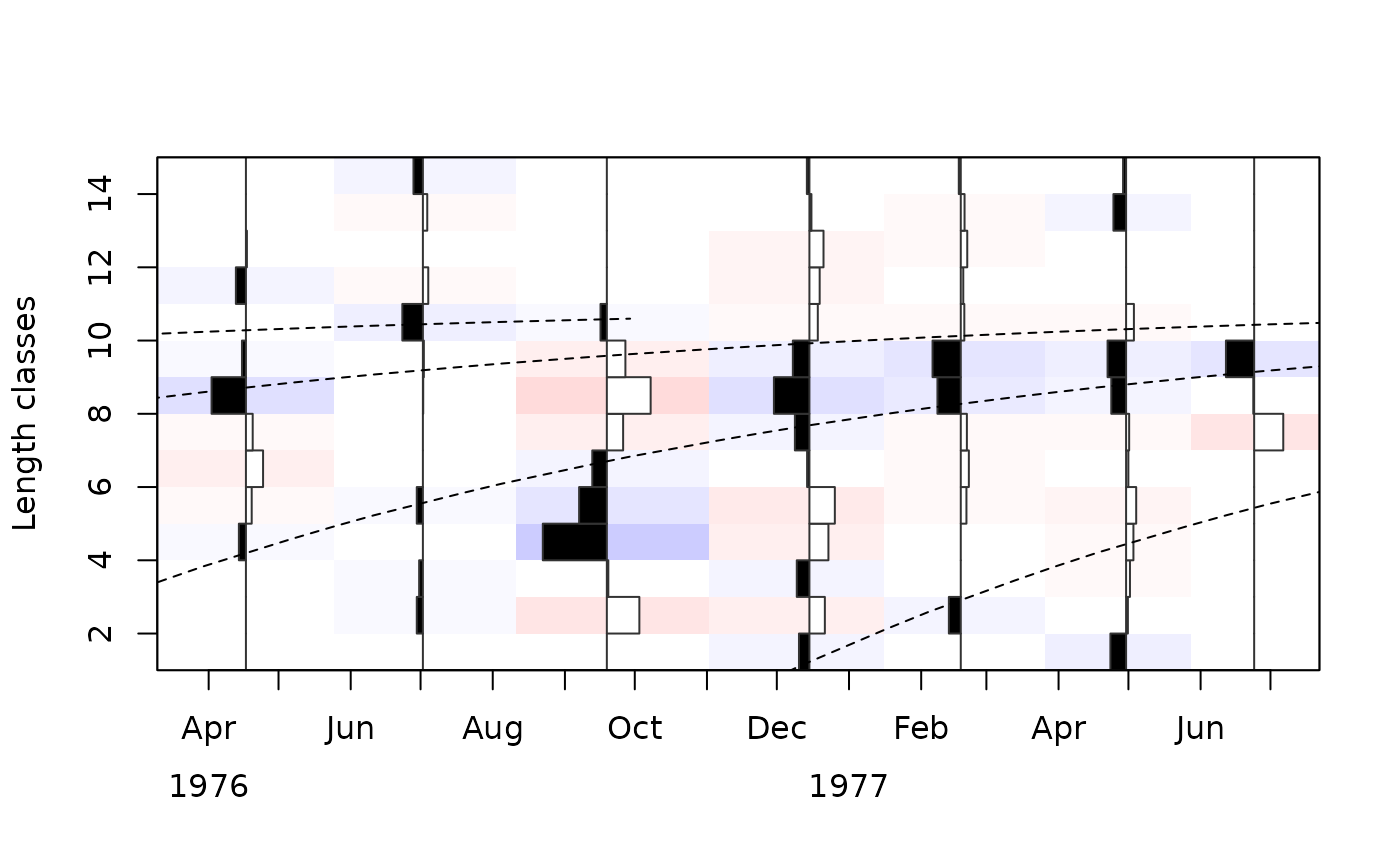
#> 11.1111111 1.0600000 0.8452627 0.0000000 0.0000000 2.1168208
plot(fit3)
 ### K-Scan (varies K, Linf is fixed) ###
# 'cross' method
fit4 <- ELEFAN(
lfq = alba, method = "cross",
Linf_fix = 10,
K_range = round(exp(seq(from = log(0.1), to = log(2), length.out = 50)),2),
cross.date = alba$dates[3], cross.midLength = alba$midLengths[4],
plot = FALSE
)
#> Optimisation procedure of ELEFAN is running.
#> This will take some time.
#> The progress bar will inform you about the progress of the calculations.
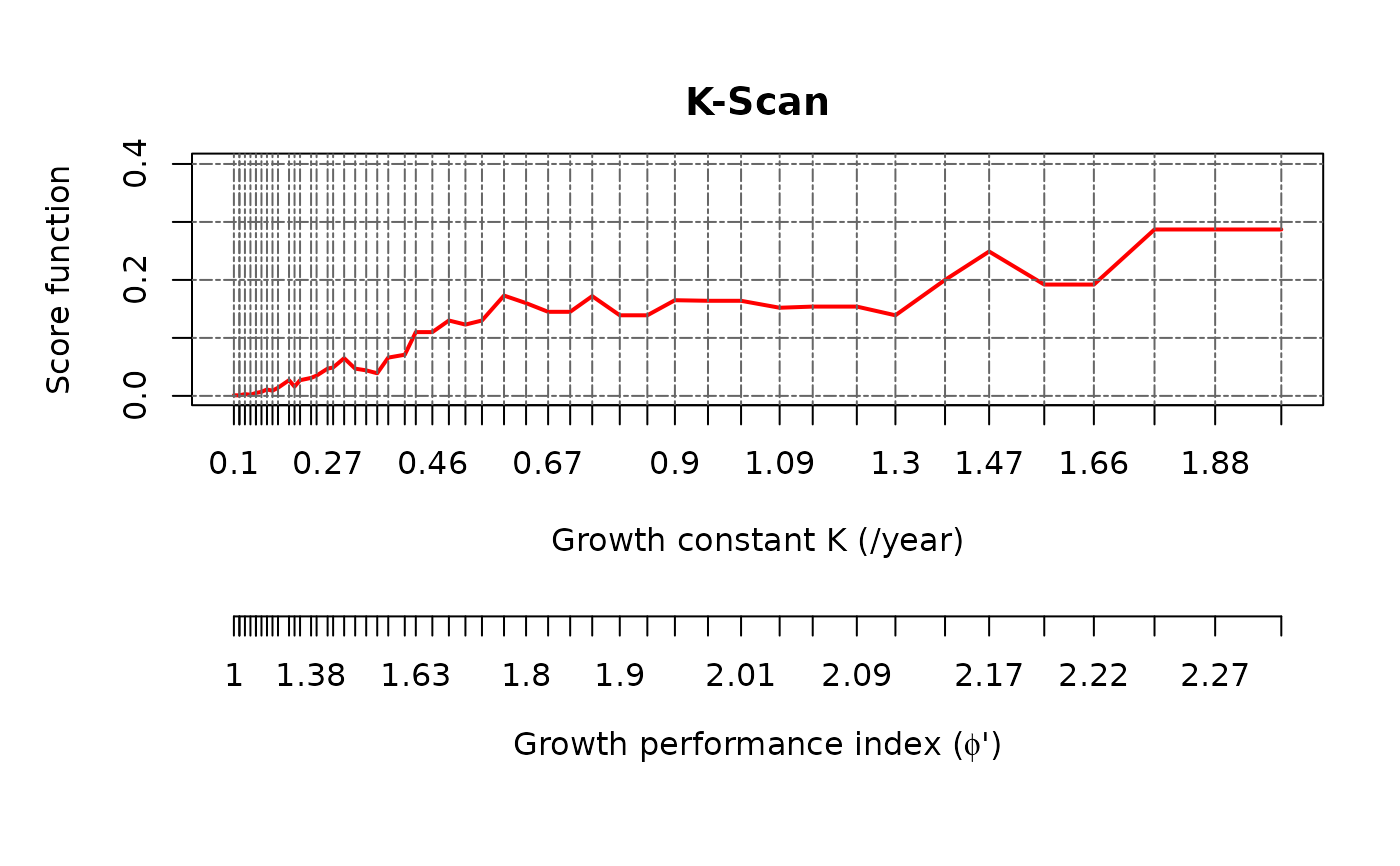 fit4$Rn_max; unlist(fit4$par)
#> [1] 0.287
#> Linf K t_anchor C ts phiL
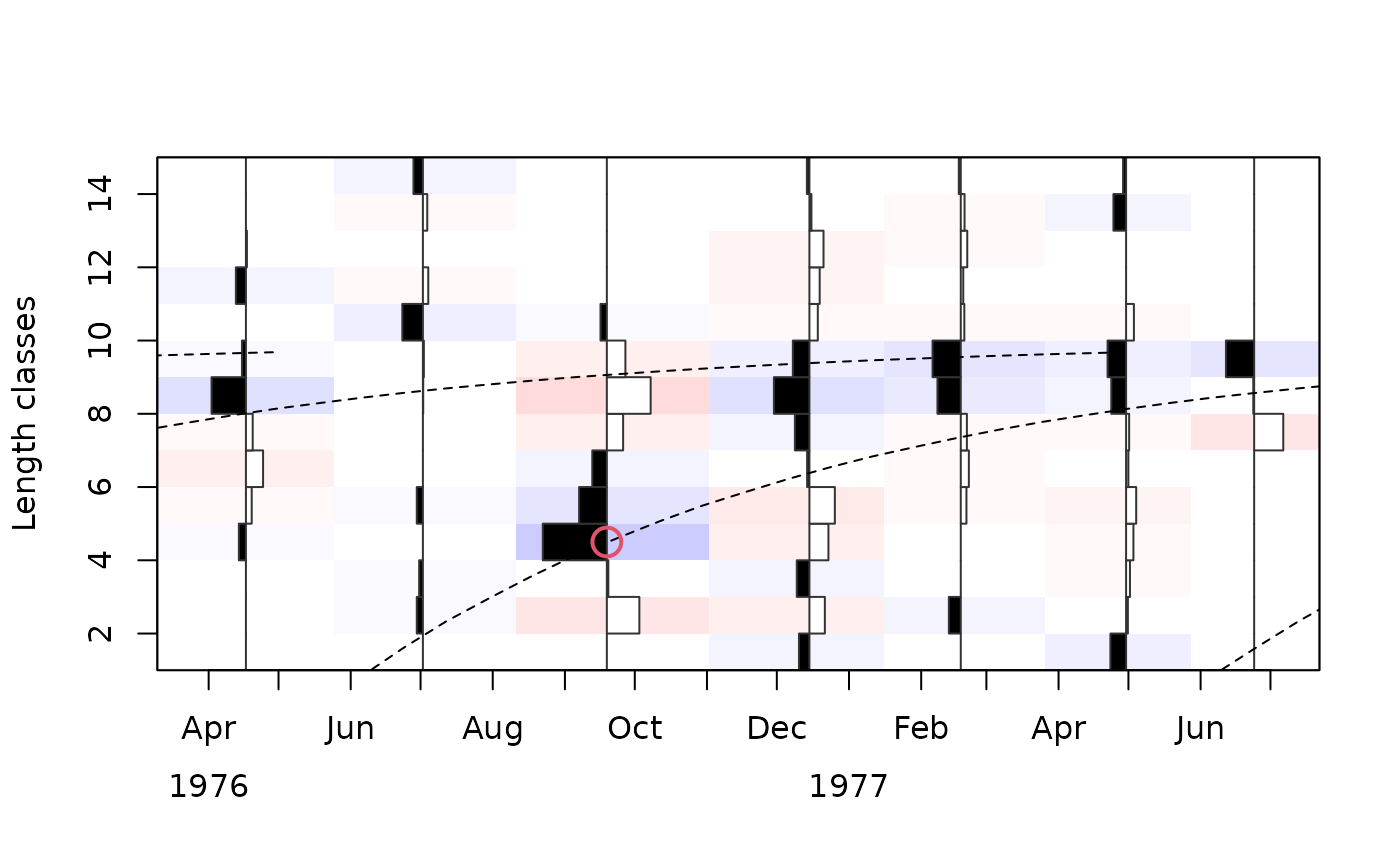
#> 10.000000 1.770000 0.380000 0.000000 0.000000 2.247973
plot(fit4); points(alba$dates[3], alba$midLengths[4], col=2, cex=2, lwd=2)
 # }